A test used to determine if sample data or a population follows the Normal Distribution. During hypothesis testing, a normality test must be conducted against the data set for a 1 sample t-test or sets for a 2 sample t-test to determine which test to use during hypothesis testing. Normality tests can be conducted in Minitab or any other statistical software package.
Example:
A new supplier has given you 18 samples of their cylander which will be used in your production process. You are tasked with running a hypothesis test on the diameter of the cylander to determine if it meets your target value. Before you can do that, you must find out whether or not the sample data follows the Normal Distribution. To do this you will conduct a Normality Test in Minitab.
Once we measure each sample, we can input it into Minitab.
| Sample data of Diameter Length of Cylinder | ||
|---|---|---|
| 10.00 | 10.25 | 10.50 |
| 9.75 | 10.00 | 10.00 |
| 9.00 | 11.00 | 10.00 |
| 10.25 | 10.50 | 10.00 |
| 9.50 | 9.75 | 9.25 |
| 10.75 | 10.00 | 10.25 |
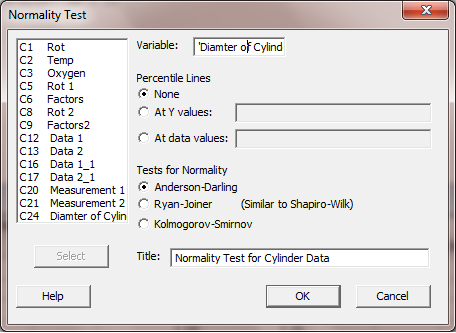
From here, we can run the Normality Test in Minitab.
Stat –> Basic Statistics –> Normality Test
From here, click on the Variable text box and then select the data set that you want to use from the left hand side of the popup.
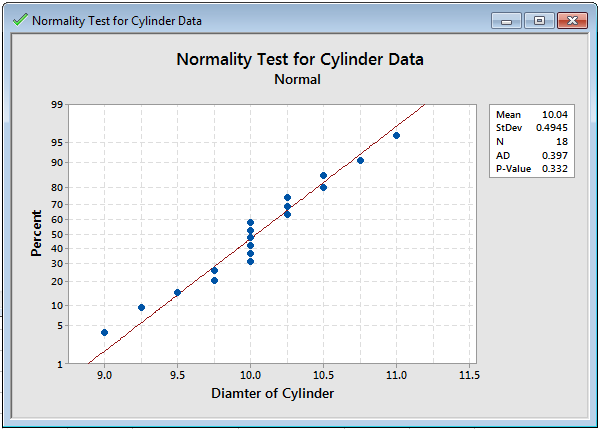
After clicking OK, a dot graph is created showing the diameter length of each sample. The mean, number of samples, and P-Value is displayed on the right hand side of the graph. Since the P-Value is greater than .05, we fail to reject the hypothesis. The data is normal!