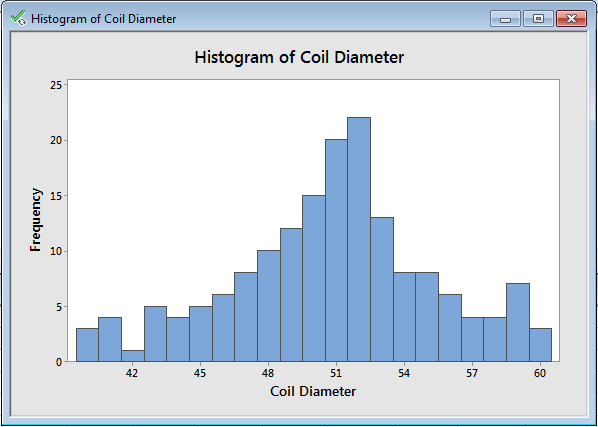
A graphical representation of the distribution of a set of data. The horizontal axis is the response variable (bin).
The vertical axis consist of the frequency or count of each bin.
A graphical representation of the distribution of a set of data. The horizontal axis is the response variable (bin).
The vertical axis consist of the frequency or count of each bin.