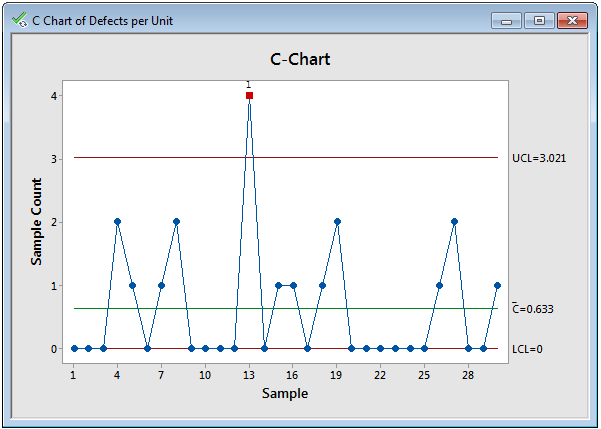
A graphical chart that displays the total count of defects per unit that occur during the sampling period.
The number of samples must be the same throughout each sampling period.
A graphical chart that displays the total count of defects per unit that occur during the sampling period.
The number of samples must be the same throughout each sampling period.