ANALYSIS OF MEANS (ANOM)

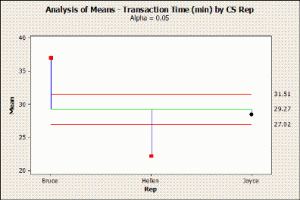
Analysis of Means is a graphical technique which graphs the Means for each level of a factor compared to the overall mean. It is often displayed in a format similar to a control chart, where significance is indicated by a point outside upper and lower “decision limits”. These decision limits are determined using a significance level (alpha) specified by the user.
Examples
The time, in minutes, to complete clients’ life insurance policy applications was recorded for three customer service representatives. In the illustration, Bill and Heather appear to have mean service times that are significantly different from the overall mean.
The green line represents the overall mean service time. The red lines represent the upper and lower decision limits for the mean based on a 95% confidence level (alpha = .05).
