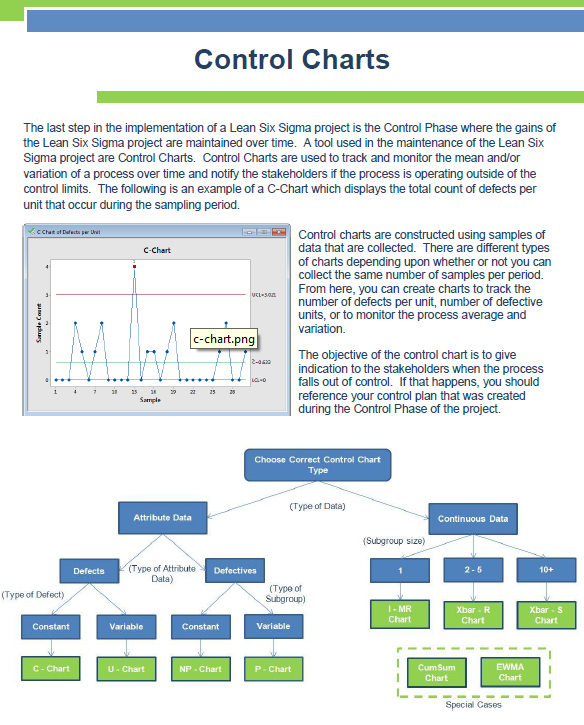
Used to track and monitor the mean and/or variation of a process over time. Control charts are used to notify the team if data in a process is outside the control limits. The first control charts were developed by Dr. Shewhart in 1924. There are many different types of control charts including C-Charts, NP-Charts, I-MR Charts, and U-Charts.