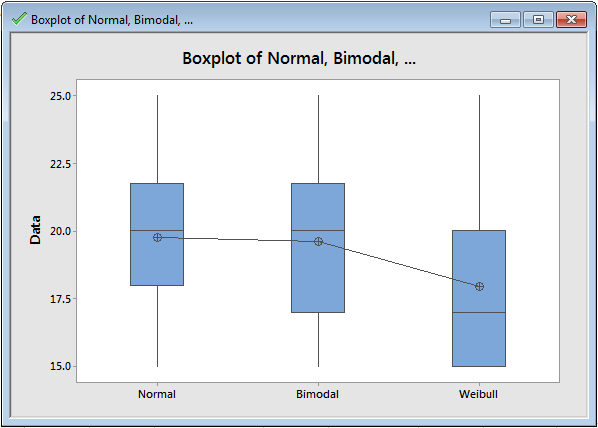
Provides a graphical representation of the minimum, maximum, median, first quartile, and fourth quartile of the data plotted. A minimum of 10 data points should be used to create a box plot. The first and fourth quartiles are displayed with the lines (whiskers). The second and third quartile, along with the median are shown in the box. Box plots are used to show the distribution of data.