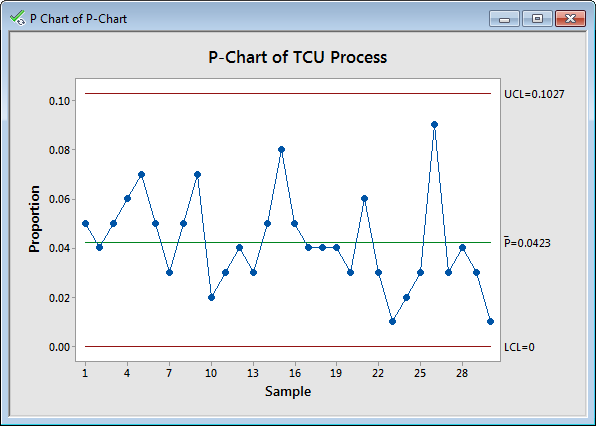
Used when each unit can be considered pass or fail regardless of how many defects the unit has.
The P-Chart shows the number of failures against the total number of units as a percentage.
Used when each unit can be considered pass or fail regardless of how many defects the unit has.
The P-Chart shows the number of failures against the total number of units as a percentage.